3 EMA + RSI with Trail Stop [Free990] (LOW TF)This trading strategy combines three Exponential Moving Averages (EMAs) to identify trend direction, uses RSI to signal exit conditions, and applies both a fixed percentage stop-loss and a trailing stop for risk management. It aims to capture momentum when the faster EMAs cross the slower EMA, then uses RSI thresholds, time-based exits, and stops to close trades.
Short Explanation of the Logic
Trend Detection: When the 10 EMA crosses above the 20 EMA and both are above the 100 EMA (and the current price bar closes higher), it triggers a long entry signal. The reverse happens for a short (the 10 EMA crosses below the 20 EMA and both are below the 100 EMA).
RSI Exit: RSI crossing above a set threshold closes long trades; crossing below another threshold closes short trades.
Time-Based Exit: If a trade is in profit after a set number of bars, the strategy closes it.
Stop-Loss & Trailing Stop: A fixed stop-loss based on a percentage from the entry price guards against large drawdowns. A trailing stop dynamically tightens as the trade moves in favor, locking in potential gains.
Detailed Explanation of the Strategy Logic
Exponential Moving Average (EMA) Setup
Short EMA (out_a, length=10)
Medium EMA (out_b, length=20)
Long EMA (out_c, length=100)
The code calculates three separate EMAs to gauge short-term, medium-term, and longer-term trend behavior. By comparing their relative positions, the strategy infers whether the market is bullish (EMAs stacked positively) or bearish (EMAs stacked negatively).
Entry Conditions
Long Entry (entryLong): Occurs when:
The short EMA (10) crosses above the medium EMA (20).
Both EMAs (short and medium) are above the long EMA (100).
The current bar closes higher than it opened (close > open).
This suggests that momentum is shifting to the upside (short-term EMAs crossing up and price action turning bullish). If there’s an existing short position, it’s closed first before opening a new long.
Short Entry (entryShort): Occurs when:
The short EMA (10) crosses below the medium EMA (20).
Both EMAs (short and medium) are below the long EMA (100).
The current bar closes lower than it opened (close < open).
This indicates a potential shift to the downside. If there’s an existing long position, that gets closed first before opening a new short.
Exit Signals
RSI-Based Exits:
For long trades: When RSI exceeds a specified threshold (e.g., 70 by default), it triggers a long exit. RSI > short_rsi generally means overbought conditions, so the strategy exits to lock in profits or avoid a pullback.
For short trades: When RSI dips below a specified threshold (e.g., 30 by default), it triggers a short exit. RSI < long_rsi indicates oversold conditions, so the strategy closes the short to avoid a bounce.
Time-Based Exit:
If the trade has been open for xBars bars (configurable, e.g., 24 bars) and the trade is in profit (current price above entry for a long, or current price below entry for a short), the strategy closes the position. This helps lock in gains if the move takes too long or momentum stalls.
Stop-Loss Management
Fixed Stop-Loss (% Based): Each trade has a fixed stop-loss calculated as a percentage from the average entry price.
For long positions, the stop-loss is set below the entry price by a user-defined percentage (fixStopLossPerc).
For short positions, the stop-loss is set above the entry price by the same percentage.
This mechanism prevents catastrophic losses if the market moves strongly against the position.
Trailing Stop:
The strategy also sets a trail stop using trail_points (the distance in price points) and trail_offset (how quickly the stop “catches up” to price).
As the market moves in favor of the trade, the trailing stop gradually tightens, allowing profits to run while still capping potential drawdowns if the price reverses.
Order Execution Flow
When the conditions for a new position (long or short) are triggered, the strategy first checks if there’s an opposite position open. If there is, it closes that position before opening the new one (prevents going “both long and short” simultaneously).
RSI-based and time-based exits are checked on each bar. If triggered, the position is closed.
If the position remains open, the fixed stop-loss and trailing stop remain in effect until the position is exited.
Why This Combination Works
Multiple EMA Cross: Combining 10, 20, and 100 EMAs balances short-term momentum detection with a longer-term trend filter. This reduces false signals that can occur if you only look at a single crossover without considering the broader trend.
RSI Exits: RSI provides a momentum oscillator view—helpful for detecting overbought/oversold conditions, acting as an extra confirmation to exit.
Time-Based Exit: Prevents “lingering trades.” If the position is in profit but failing to advance further, it takes profit rather than risking a trend reversal.
Fixed & Trailing Stop-Loss: The fixed stop-loss is your safety net to cap worst-case losses. The trailing stop allows the strategy to lock in gains by following the trade as it moves favorably, thus maximizing profit potential while keeping risk in check.
Overall, this approach tries to capture momentum from EMA crossovers, protect profits with trailing stops, and limit risk through both a fixed percentage stop-loss and exit signals from RSI/time-based logic.
在脚本中搜索"3 ema"

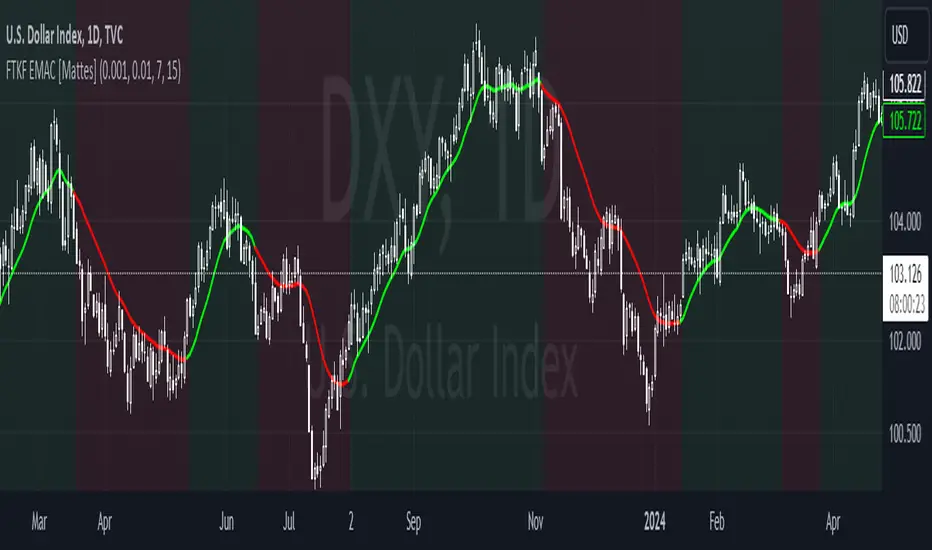
Fourier Transformed & Kalman Filtered EMA Crossover [Mattes]The Fourier Transformed & Kalman Filtered EMA Crossover (FTKF EMAC) is a trend-following indicator that leverages Fourier Transform approximation, Kalman Filtration, and two Exponential Moving Averages (EMAs) of different lengths to provide accurate and smooth market trend signals. By combining these three components, it captures the underlying market cycles, reduces noise, and produces actionable insights, making it suitable for detecting both emerging trends and confirming existing ones.
TECHNICALITIES:
>>> The Fourier Transform approximation is designed to identify dominant cyclical patterns in price action by focusing on key frequencies, while filtering out noise and less significant movements. It emphasizes the most meaningful price cycles, enabling the indicator to isolate important trends while ignoring minor fluctuations. This cyclical awareness adds an extra layer of depth to trend detection, allowing the EMAs to work with a cleaner and more reliable data set.
>>> The Kalman Filter adds dynamic noise reduction, adjusting its predictions of future price trends based on past and current data. As new price data comes in, the filter recalibrates itself to ensure that the price action remains smooth and devoid of erratic movements. This real-time adjustment is key to minimizing lag while avoiding false signals, which ensures that the EMAs react to more accurate and stable market data. The Kalman Filter’s ability to smooth price data without losing sensitivity to trend changes complements the Fourier approximation, ensuring a high level of precision in volatile and stable market environments.
>>> The EMA Crossover involves using two EMAs: a shorter EMA that reacts quickly to price movements and a longer EMA that responds more slowly. The shorter EMA is responsible for capturing immediate market shifts, detecting potential bullish or bearish trends. The longer EMA smooths out price fluctuations and provides trend confirmation, working with the shorter EMA to ensure the signals are reliable. When the shorter EMA crosses above the longer EMA, it indicates a bullish trend, likewise when it goes below the longer EMA, it signals a bearish trend. This setup provides a clear way to track market direction, with color-coded signals (green for bullish, red for bearish) for visual clarity. The flexibility of adjusting the EMA periods allows traders to fine-tune the indicator to their preferred timeframe and strategy, making it adaptable to different market conditions.
|-> A key technical aspect is that the first EMA should always be shorter than the second one. If the first EMA is longer than the second, the tool’s effectiveness is compromised because the faster EMA is designed to signal long conditions, while the longer one is made for signaling a bearish trend. Reversing their roles would lead to delayed or confused signals, reducing the indicator’s ability to detect trend shifts early and making it less efficient in volatile markets. This is the only key weakness of the indicator, failure to submit to this rule will result in confusion.
>>> These components work together like a clock to create a comprehensive and effective trend-following system. The Fourier approximation highlights key cyclical movements, the Kalman Filter refines these movements by removing noise, and the EMAs interpret the filtered data to generate actionable trend signals. Each component enhances the next, ensuring that the final output is both responsive and reliable, with minimal false signals or lag. creating an indicator using widespread concepts which haven't been combined before.
Summary
This indicator combines Fourier Transform approximation, Kalman Filtration, and two EMAs of different lengths to deliver accurate and timely trend-following signals. The Fourier approximation identifies dominant market cycles, while the Kalman Filter dynamically removes noise and refines the price data in real time. The two EMAs then use this filtered data to generate buy and sell signals based on their crossovers. The shorter EMA reacts quickly to price changes, while the longer EMA provides smoother trend confirmation. The components work in synergy to capture trends with minimal false signals or lag, ensuring traders can act promptly on market shifts. Customizable EMA periods make the tool adaptable to different market conditions, enhancing its versatility for various trading strategies.
To use the indicator, traders should adjust the EMA lengths based on their timeframe and strategy, ensuring that the shorter EMA remains shorter than the longer EMA to preserve the tool’s responsiveness. The color-coded signals offer visual clarity, making it easy to identify potential entry and exit points. This confluence of Fourier, Kalman, and EMA methodologies provides a smooth, highly effective trend-following tool that excels in both trending and ranging markets.
Dema Ema Crossover | viResearchDema Ema Crossover | viResearch
Conceptual Foundation and Innovation
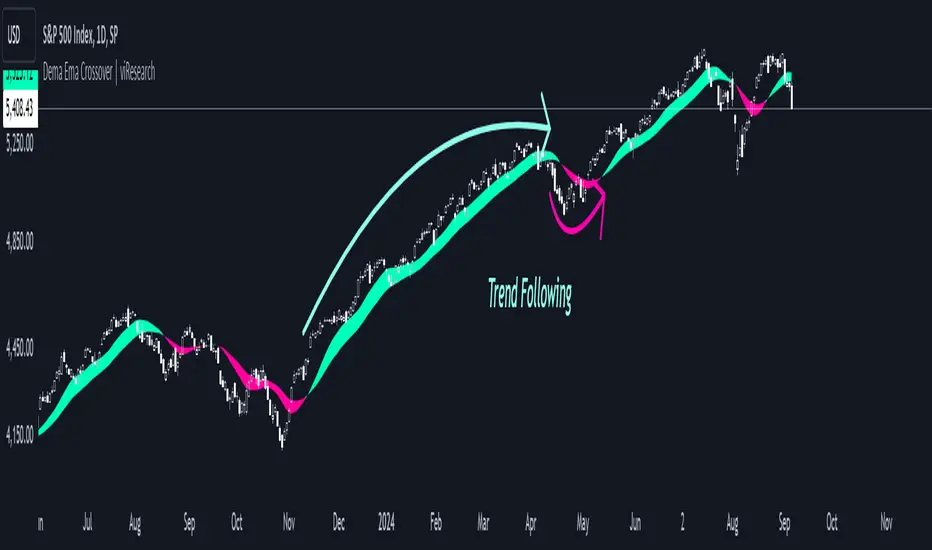
The "Dema Ema Crossover" indicator combines the strengths of the Double Exponential Moving Average (DEMA) with an Exponential Moving Average (EMA) crossover strategy. The DEMA is well-known for its ability to reduce lag compared to standard moving averages, offering smoother trend-following signals. In this script, the DEMA is used as the foundation, with two EMAs applied on top of it to further refine the trend detection and crossover points. This combination provides traders with a robust tool for identifying trend shifts and potential entry or exit points.
By leveraging the faster responsiveness of the DEMA and using EMA crossovers, the "Dema Ema Crossover" indicator helps traders detect and act on trend reversals more efficiently, making it a powerful solution for capturing both short- and long-term market movements.
Technical Composition and Calculation
The "Dema Ema Crossover" script consists of three main components: the Double Exponential Moving Average (DEMA), the fast EMA, and the slow EMA. The DEMA is calculated based on the selected length and source price, providing a smooth representation of market trends. Two EMAs are then applied to the DEMA, with one being faster (shorter period) and the other slower (longer period). The crossover between these two EMAs generates the signals for trend changes.
For the DEMA, the calculation uses the ta.dema function, which reduces lag while maintaining smoothness in the moving average. The fast and slow EMAs are calculated using the ta.ema function, with the fast EMA responding more quickly to price changes, while the slow EMA captures broader trends. The crossover between these two EMAs is used to generate buy and sell signals based on the direction of the crossover.
Features and User Inputs
The "Dema Ema Crossover" script offers several customizable inputs that allow traders to tailor the indicator to their trading strategies. The DEMA Length controls how smooth the DEMA is, with a longer length creating a slower-moving average and a shorter length providing a more responsive one. The Fast EMA Length and Slow EMA Length are also customizable, allowing traders to adjust the sensitivity of the crossover signals based on their market outlook and preferred trading timeframe.
Practical Applications
The "Dema Ema Crossover" indicator is designed for traders looking for a reliable crossover strategy that combines the responsiveness of the DEMA with the precision of EMA crossovers. This tool is particularly effective for:
Identifying Trend Reversals: The crossover between the fast and slow EMAs applied to the DEMA provides early signals of potential trend reversals, allowing traders to position themselves in the market more effectively. Confirming Trend Direction: The combined effect of the DEMA and EMA crossovers helps confirm the strength of a trend, improving decision-making around trade entries and exits. Adapting to Different Market Conditions: The customizable parameters allow traders to adjust the sensitivity of the crossover signals, making the indicator suitable for both fast-moving markets and slower, trending environments.
Advantages and Strategic Value
The "Dema Ema Crossover" script offers a significant advantage by combining the smoothness of the DEMA with the accuracy of EMA crossovers. The DEMA’s ability to reduce lag while maintaining responsiveness makes it ideal for trend-following strategies, while the crossover between the fast and slow EMAs provides precise entry and exit points. This combination reduces false signals and helps traders adapt to changing market conditions, resulting in a more reliable and efficient trend-following system.
Alerts and Visual Cues
The script includes alert conditions to notify traders of key crossover events. The "Dema Ema Crossover Long" alert is triggered when the fast EMA crosses above the slow EMA, signaling a potential upward trend. Conversely, the "Dema Ema Crossover Short" alert signals a possible downward trend when the fast EMA crosses below the slow EMA. Visual cues such as colored fills between the two EMAs highlight these crossover points on the chart, helping traders quickly identify trend shifts.
Summary and Usage Tips
The "Dema Ema Crossover | viResearch" indicator provides traders with a powerful combination of the DEMA and EMA crossovers, offering a smooth yet responsive tool for detecting trend reversals and confirming trend direction. By incorporating this script into your trading strategy, you can improve your ability to capture trend changes with greater accuracy, reducing the impact of market noise. Whether you are focused on short-term market moves or long-term trends, the "Dema Ema Crossover" indicator offers a flexible and reliable solution for traders at all levels.
Note: Backtests are based on past results and are not indicative of future performance.
Long/Short EMA Premium [NL]1. EMA Calculation :
- The script calculates three Exponential Moving Averages (EMAs): EMA 1, EMA 2, and EMA 50.
- The lengths of EMA 1 and EMA 2 are customizable by the user inputs `ema1Length` and `ema2Length`, respectively.
- EMA 50 is fixed with a length of 50.
2. EMA Crossover Detection :
- The script detects crossovers between EMA 1 and EMA 2 using the `ta.crossover()` and `ta.crossunder()` functions, storing the crossover events in the `cross` variable.
3. Crossover Symbol :
- A triangle-up shape is plotted below the bars when there is a crossover between EMA 1 and EMA 2. This symbol visually indicates the crossover points.
4. Trade Signals :
- Long and short signals are generated based on the crossover events and the relationship between the closing price and EMA 1.
- For a long signal, EMA 1 must cross above EMA 2, and both the current and previous closing prices must be above EMA 1.
- For a short signal, EMA 1 must cross below EMA 2, and both the current and previous closing prices must be below EMA 1.
5. Stop Conditions :
- Stop conditions are used to exit long or short trades.
- If in a long trade, the script checks if the low of the previous candle crossed below EMA 1 and the high of the current candle is below EMA 1. If true, it triggers the "Stop Long" condition.
- If in a short trade, the script checks if the high of the previous candle crossed above EMA 1 and the low of the current candle is above EMA 1. If true, it triggers the "Stop Short" condition.
6. Plotting :
- The script plots EMA 1, EMA 2, and EMA 50 on the chart to visualize their movements.
7. Alerts :
- The script generates alerts for EMA crossovers, long and short signals, as well as stop long and stop short conditions, allowing traders to receive notifications when these events occur.
Overall, the script provides a comprehensive EMA crossover strategy with customizable parameters and clear trade signals and exit conditions.

Anchored EMA/VWAP### Anchored EMA/VWAP Indicator
**Description:**
The **Anchored EMA/VWAP Indicator** is a powerful and versatile tool designed for traders seeking to analyze price trends and momentum from a user-defined anchor point in time. Built for TradingView using Pine Script v6, this indicator calculates and displays multiple **Exponential Moving Averages (EMAs)**, **Volume-Weighted Exponential Moving Averages (VWEMAs)**, and a **Volume-Weighted Average Price (VWAP)**, all anchored to a specific date and time chosen by the user. By anchoring these calculations, traders can focus on price action relative to significant market events, such as news releases, earnings reports, or key support/resistance levels.
The indicator supports multi-timeframe (MTF) analysis, allowing users to compute EMAs, VWEMAs, and VWAP on a higher or custom timeframe (e.g., 5-minute, 1-hour, daily) while overlaying the results on the current chart. It also includes customizable cross signals for EMA and VWEMA pairs, marked with distinct shapes (circles, diamonds, squares) to highlight potential trend changes or reversals. These features make the indicator ideal for trend-following, momentum trading, and identifying key price levels across various markets, including stocks, forex, cryptocurrencies, and commodities.
**Key Features:**
- **Anchored Calculations**: EMAs, VWEMAs, and VWAP start calculations from a user-specified anchor time, enabling analysis relative to significant market moments.
- **Multi-Timeframe Support**: Compute indicators on any timeframe (e.g., 60-minute, daily) and display them on the chart’s timeframe for flexible analysis.
- **Customizable EMAs and VWEMAs**: Four EMAs and four VWEMAs with adjustable lengths (default: 9, 21, 50, 100) and colors, with options to show or hide each.
- **Volume-Weighted Metrics**: VWAP and VWEMAs incorporate volume data, providing a more robust representation of market activity compared to standard EMAs.
- **Cross Signals**: Visual markers (circles, diamonds, squares) for crossovers between EMA and VWEMA pairs, with customizable visibility to highlight bullish (up) or bearish (down) signals.
- **User-Friendly Interface**: Organized input groups for General, EMA, VWEMA, VWAP, Arrow Settings, and Cross Visibility, with intuitive inline inputs for length and color customization.
- **Visual Clarity**: Overlaid on the price chart with distinct colors and line styles (dotted for EMAs, dashed for VWEMAs, solid for VWAP) to ensure easy interpretation.
**How to Use:**
1. **Set the Anchor Time**: Click a specific bar or enter a date/time (default: June 1, 2025) to start calculations from a significant market event.
2. **Select Timeframe**: Choose a timeframe (e.g., "5" for 5-minute, "D" for daily) to compute the indicators, allowing alignment with your trading strategy.
3. **Customize EMAs and VWEMAs**: Adjust lengths and colors for up to four EMAs and VWEMAs, and toggle their visibility to focus on relevant lines.
4. **Enable VWAP**: Display the anchored VWAP to identify volume-weighted price levels, useful as dynamic support/resistance.
5. **Monitor Cross Signals**: Enable cross visibility for specific EMA or VWEMA pairs to spot potential trend changes. Bullish crosses (e.g., shorter EMA crossing above longer EMA) are marked with green shapes below the bar, while bearish crosses are marked with red shapes above the bar.
6. **Interpret Signals**: Use EMA/VWEMA crossovers for trend confirmation, VWAP as a mean-reversion level, and volume-weighted VWEMAs for momentum analysis in high-volume markets.
**Use Cases:**
- **Trend Trading**: Identify trend direction using EMA and VWEMA crossovers, with shorter lengths (e.g., 9, 21) for faster signals and longer lengths (e.g., 50, 100) for trend confirmation.
- **Mean Reversion**: Use the anchored VWAP as a dynamic support/resistance level to trade pullbacks or breakouts.
- **Event-Based Analysis**: Anchor the indicator to significant events (e.g., earnings, economic data releases) to analyze price behavior post-event.
- **Multi-Timeframe Strategies**: Combine higher timeframe EMAs/VWAPs with lower timeframe price action for high-probability setups.
**Settings:**
- **Anchor Time**: Set the starting point for calculations (default: June 1, 2025).
- **Timeframe**: Choose the timeframe for calculations (default: 5-minute).
- **EMA/VWEMA Lengths**: Default lengths of 9, 21, 50, and 100 for both EMAs and VWEMAs, adjustable per user preference.
- **Colors**: Customizable colors with slight transparency for visual clarity.
- **Cross Visibility**: Toggle specific EMA and VWEMA cross signals (e.g., EMA1/EMA2, VWEMA1/VWEMA3) to reduce chart clutter.
- **Arrow Colors**: Green for bullish crosses, red for bearish crosses.
**Notes:**
- The indicator is overlaid on the price chart, ensuring seamless integration with price action analysis.
- VWEMAs and VWAP are volume-sensitive, making them particularly effective in markets with significant volume fluctuations.
- Ensure the anchor time is set to a valid historical or future bar to avoid calculation errors.
- Cross signals are conditional on non-NA values to prevent false positives during initialization.
**Author**: NEPOLIX
**Version**: 6 (Pine Script v6)
**Published**: For TradingView Community
This indicator is a must-have for traders looking to combine anchored, volume-weighted, and multi-timeframe analysis into a single, customizable tool. Whether you're a day trader, swing trader, or long-term investor, the Anchored EMA/VWAP Indicator provides actionable insights for informed trading decisions.

VHX EMA 135/315📈 EMA 135/315 Cross Strategy – Your Trend Compass with Smart Confirmations
🔍 Core Idea
The EMA 135/315 Cross strategy is a trend-following system.
It tracks two moving averages:
EMA 135 → the “fast” line that reacts to short-term price moves
EMA 315 → the “slow” line that reacts to the bigger trend
When the fast EMA crosses above the slow EMA → market momentum is turning up → BUY signal 🟢
When the fast EMA crosses below the slow EMA → momentum is turning down → SELL signal 🔴
This gives you a clear entry trigger — no guessing, no overcomplication.
✨ On Your Chart
BUY/SELL Arrows
🟢 Green arrow = bullish cross → trend turning up
🔴 Red arrow = bearish cross → trend turning down
Trend Info Panel (Top Left)
Current Trend: BUY / SELL / Neutral
Last Cross: how many bars ago it happened
EMA Gap in %: measures the strength of the trend
Status: “Approaching” if EMAs are getting close → possible cross soon
Automatic TP/SL Levels
📈 TP line (+2% from entry)
📉 SL line (–0.5% from entry)
Saves time — you instantly see your target and protection
EMA Distance Meter
Big % gap = strong trend momentum 🚀
Small % gap = weak or sideways market ⚠️
Real-Time Alerts
You get notified when a cross happens, even if you’re away from the screen
🧠 The Logic Behind It
The EMA 135 reacts faster → it reflects short-term momentum
The EMA 315 moves slower → it reflects the main trend
When the fast EMA overtakes the slow EMA: short-term strength now aligns with the long-term trend → higher probability of a sustained move
The gap % tells you how strong the alignment is — large gap = cleaner moves, small gap = market in transition
“Approaching” status warns that the EMAs are converging, which often happens before a reversal
📊 Boosting the Strategy with Volume Analysis
The EMA cross is a strong trigger, but volume confirms the quality of the move:
High Volume + Cross → more reliable signal, as strong market participation is pushing the trend
Low Volume + Cross → caution, the move might be weak or a false breakout
💡 Tip:
Check the volume histogram or a volume-based indicator (e.g., Volume Profile, OBV).
On a BUY signal: volume should spike above the recent average.
On a SELL signal: watch for strong selling volume bars.
📍 Adding Support & Resistance for Precision
Support and resistance levels help filter out bad trades and optimize entries:
Best BUY setups:
EMA 135 crosses above EMA 315 near a known support zone
Bonus if volume confirms the move
Avoid buying directly into a strong resistance
Best SELL setups:
EMA 135 crosses below EMA 315 near a known resistance zone
Bonus if selling volume is strong
Avoid selling directly into a major support
💡 Use tools like horizontal lines, previous highs/lows, and Volume Profile nodes to spot these zones.
📈 Best Usage Practices
Timeframes
Lower timeframes (1m–5m) → more signals, but more noise → best for scalping with extra filters
Always Combine With Confirmation
EMA Cross = Trigger
Volume spike = Confirmation
S/R zone in your favor = High-probability setup
Manage Risk
Start with the built-in TP/SL
Adjust SL if volatility is higher than usual
Consider trailing stop once price moves in your favor
Avoid Sideways Markets
If EMA gap % is very small and crosses happen often → stand aside until a clear direction forms
Use Alerts
Set alerts for BUY & SELL crosses so you never miss a setup
In short:
This isn’t just an EMA cross indicator — it’s a trend system with built-in risk management, strength measurement, and pre-trade preparation. Combine it with volume confirmation and smart use of support/resistance, and you turn a simple signal into a high-probability trading edge.

Combined EMA Technical AnalysisThis script is written in Pine Script (version 5) for TradingView and creates a comprehensive technical analysis indicator called "Combined EMA Technical Analysis." It overlays multiple technical indicators on a price chart, including Exponential Moving Averages (EMAs), VWAP, MACD, PSAR, RSI, Bollinger Bands, ADX, and external data from the S&P 500 (SPX) and VIX indices. The script also provides visual cues through colors, shapes, and a customizable table to help traders interpret market conditions.
Here’s a breakdown of the script:
---
### **1. Purpose**
- The script combines several popular technical indicators to analyze price trends, momentum, volatility, and market sentiment.
- It uses color coding (green for bullish, red for bearish, gray/white for neutral) and a table to display key information.
---
### **2. Custom Colors**
- Defines custom RGB colors for bullish (`customGreen`), bearish (`customRed`), and neutral (`neutralGray`) signals to enhance visual clarity.
---
### **3. User Inputs**
- **EMA Colors**: Users can customize the colors of five EMAs (8, 20, 9, 21, 50 periods).
- **MACD Settings**: Adjustable short length (12), long length (26), and signal length (9).
- **RSI Settings**: Adjustable length (14).
- **Bollinger Bands Settings**: Length (20), multiplier (2), and proximity threshold (0.1% of band width).
- **ADX Settings**: Adjustable length (14).
- **Table Settings**: Position (e.g., "Bottom Right") and text size (e.g., "Small").
---
### **4. Indicator Calculations**
#### **Exponential Moving Averages (EMAs)**
- Calculates five EMAs: 8, 20, 9, 21, and 50 periods based on the closing price.
- Used to identify short-term and long-term trends.
#### **Volume Weighted Average Price (VWAP)**
- Resets daily and calculates the average price weighted by volume.
- Color-coded: green if price > VWAP (bullish), red if price < VWAP (bearish), white if neutral.
#### **MACD (Moving Average Convergence Divergence)**
- Uses short (12) and long (26) EMAs to compute the MACD line, with a 9-period signal line.
- Displays "Bullish" (green) if MACD > signal, "Bearish" (red) if MACD < signal.
#### **Parabolic SAR (PSAR)**
- Calculated with acceleration factors (start: 0.02, increment: 0.02, max: 0.2).
- Indicates trend direction: green if price > PSAR (bullish), red if price < PSAR (bearish).
#### **Relative Strength Index (RSI)**
- Measures momentum over 14 periods.
- Highlighted in green if > 70 (overbought), red if < 30 (oversold), white otherwise.
#### **Bollinger Bands (BB)**
- Uses a 20-period SMA with a 2-standard-deviation multiplier.
- Color-coded based on price position:
- Green: Above upper band or close to it.
- Red: Below lower band or close to it.
- Gray: Neutral (within bands).
#### **Average Directional Index (ADX)**
- Manually calculates ADX to measure trend strength:
- Strong trend: ADX > 25.
- Very strong trend: ADX > 50.
- Direction: Bullish if +DI > -DI, bearish if -DI > +DI.
#### **EMA Crosses**
- Detects bullish (crossover) and bearish (crossunder) events for:
- EMA 9 vs. EMA 21.
- EMA 8 vs. EMA 20.
- Visualized with green (bullish) or red (bearish) circles.
#### **SPX and VIX Data**
- Fetches daily closing prices for the S&P 500 (SPX) and VIX (volatility index).
- SPX trend: Bullish if EMA 9 > EMA 21, bearish if EMA 9 < EMA 21.
- VIX levels: High (> 25, fear), Low (< 15, stability).
- VIX color: Green if SPX bullish and VIX low, red if SPX bearish and VIX high, white otherwise.
---
### **5. Visual Outputs**
#### **Plots**
- EMAs, VWAP, and PSAR are plotted on the chart with their respective colors.
- EMA crosses are marked with circles (green for bullish, red for bearish).
#### **Table**
- Displays a summary of indicators in a customizable position and size.
- Indicators shown (if enabled):
- EMA 8/20, 9/21, 50: Green dot if bullish, red if bearish.
- VWAP: Green if price > VWAP, red if price < VWAP.
- MACD: Green if bullish, red if bearish.
- MACD Zero: Green if MACD > 0, red if MACD < 0.
- PSAR: Green if price > PSAR, red if price < PSAR.
- ADX: Arrows for very strong trends (↑/↓), dots for weaker trends, colored by direction.
- Bollinger Bands: Arrows (↑/↓) or dots based on price position.
- RSI: Numeric value, colored by overbought/oversold levels.
- VIX: Numeric value, colored based on SPX trend and VIX level.
---
### **6. Alerts**
- Triggers alerts for EMA 8/20 crosses:
- Bullish: "EMA 8/20 Bullish Cross on Candle Close!"
- Bearish: "EMA 8/20 Bearish Cross on Candle Close!"
---
### **7. Key Features**
- **Flexibility**: Users can toggle indicators on/off in the table and adjust parameters.
- **Visual Clarity**: Consistent use of green (bullish), red (bearish), and neutral colors.
- **Comprehensive**: Combines trend, momentum, volatility, and market sentiment indicators.
---
### **How to Use**
1. Add the script to TradingView.
2. Customize inputs (colors, lengths, table position) as needed.
3. Interpret the chart and table:
- Green signals suggest bullish conditions.
- Red signals suggest bearish conditions.
- Neutral signals indicate indecision or consolidation.
4. Set up alerts for EMA crosses to catch trend changes.
This script is ideal for traders who want a multi-indicator dashboard to monitor price action and market conditions efficiently.

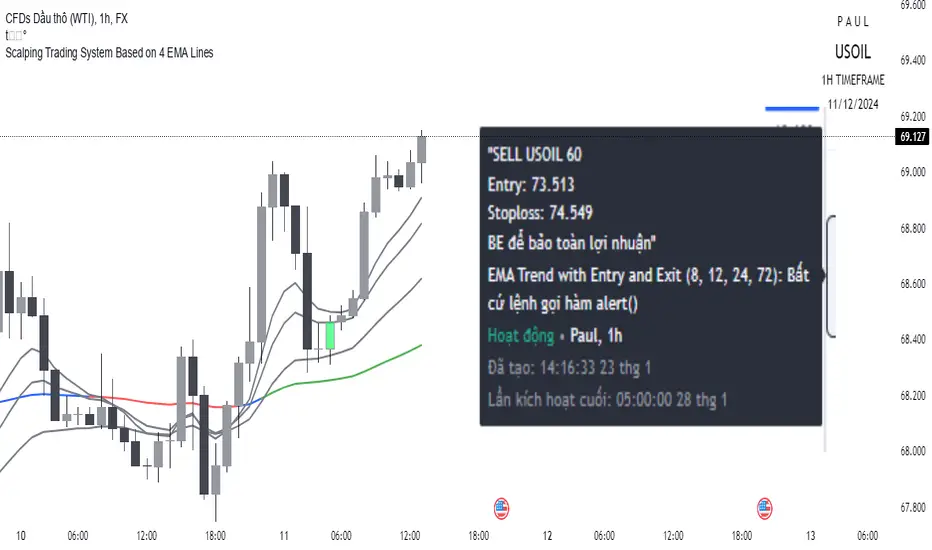
Scalping trading system based on 4 ema linesScalping Trading System Based on 4 EMA Lines
Overview:
This is a scalping trading strategy built on signals from 4 EMA moving averages: EMA(8), EMA(12), EMA(24) and EMA(72).
Conditions:
- Time frame: H1 (1 hour).
- Trading assets: Applicable to major currency pairs with high volatility
- Risk management: Use a maximum of 1-2% of capital for each transaction. The order holding time can be from a few hours to a few days, depending on the price fluctuation amplitude.
Trading rules:
Determine the main trend:
Uptrend: EMA(8), EMA(12) and EMA(24) are above EMA(72).
Downtrend: EMA(8), EMA(12) and EMA(24) are below EMA(72).
Trade in the direction of the main trend** (buy in an uptrend and sell in a downtrend).
Entry conditions:
- Only trade in a clearly trending market.
Uptrend:
- Wait for the price to correct to the EMA(24).
- Enter a buy order when the price closes above the EMA(24).
- Place a stop loss below the bottom of the EMA(24) candle that has just been swept.
Downtrend:
- Wait for the price to correct to the EMA(24).
- Enter a sell order when the price closes below the EMA(24).
- Place a stop loss above the top of the EMA(24) candle that has just been swept.
Take profit and order management:
- Take profit when the price moves 20 to 40 pips in the direction of the trade.
Use Trailing Stop to optimize profits instead of setting a fixed Take Profit.
Note:
- Do not trade within 30 minutes before and after the announcement of important economic news, as the price may fluctuate abnormally.
Additional filters:
To increase the success rate and reduce noise, this strategy uses additional conditions:
1. The price is calculated only when the candle closes (no repaint).
2. When sweeping through EMA(24), the price needs to close above EMA(24).
3. The closing price must be higher than 50% of the candle's length.
4. **The bottom of the candle sweeping through EMA(24) must be lower than the bottom of the previous candle (liquidity sweep).
---
Alert function:
When the EMA(24) sweep conditions are met, the system will trigger an alert if you have set it up.
- Entry point: The closing price of the candle sweeping through EMA(24).
- Stop Loss:
- Buy Order: Place at the bottom of the sweep candle.
- Sell Order: Place at the top of the sweep candle.
---
Note:
This strategy is designed to help traders identify profitable trading opportunities based on trends. However, no strategy is 100% guaranteed to be successful. Please test it thoroughly on a demo account before using it.
EMA RSI Trend Reversal Ver.1Overview:
The EMA RSI Trend Reversal indicator combines the power of two well-known technical indicators—Exponential Moving Averages (EMAs) and the Relative Strength Index (RSI)—to identify potential trend reversal points in the market. The strategy looks for key crossovers between the fast and slow EMAs, and uses the RSI to confirm the strength of the trend. This combination helps to avoid false signals during sideways market conditions.
How It Works:
Buy Signal:
The Fast EMA (9) crosses above the Slow EMA (21), indicating a potential shift from a downtrend to an uptrend.
The RSI is above 50, confirming strong bullish momentum.
Visual Signal: A green arrow below the price bar and a Buy label are plotted on the chart.
Sell Signal:
The Fast EMA (9) crosses below the Slow EMA (21), indicating a potential shift from an uptrend to a downtrend.
The RSI is below 50, confirming weak or bearish momentum.
Visual Signal: A red arrow above the price bar and a Sell label are plotted on the chart.
Key Features:
EMA Crossovers: The Fast EMA crossing above the Slow EMA signals potential buying opportunities, while the Fast EMA crossing below the Slow EMA signals potential selling opportunities.
RSI Confirmation: The RSI helps confirm trend strength—values above 50 indicate bullish momentum, while values below 50 indicate bearish momentum.
Visual Cues: The strategy uses green arrows and red arrows along with Buy and Sell labels for clear visual signals of when to enter or exit trades.
Signal Interpretation:
Green Arrow / Buy Label: The Fast EMA (9) has crossed above the Slow EMA (21), and the RSI is above 50. This is a signal to buy or enter a long position.
Red Arrow / Sell Label: The Fast EMA (9) has crossed below the Slow EMA (21), and the RSI is below 50. This is a signal to sell or exit the long position.
Strategy Settings:
Fast EMA Length: Set to 9 (this determines how sensitive the fast EMA is to recent price movements).
Slow EMA Length: Set to 21 (this smooths out price movements to identify the broader trend).
RSI Length: Set to 14 (default setting to track momentum strength).
RSI Level: Set to 50 (used to confirm the strength of the trend—above 50 for buy signals, below 50 for sell signals).
Risk Management (Optional):
Use take profit and stop loss based on your preferred risk-to-reward ratio. For example, you can set a 2:1 risk-to-reward ratio (2x take profit for every 1x stop loss).
Backtesting and Optimization:
Backtest the strategy on TradingView by opening the Strategy Tester tab. This will allow you to see how the strategy would have performed on historical data.
Optimization: Adjust the EMA lengths, RSI period, and risk-to-reward settings based on your asset and time frame.
Limitations:
False Signals in Sideways Markets: Like any trend-following strategy, this indicator may generate false signals during periods of low volatility or sideways movement.
Not Suitable for All Market Conditions: This indicator performs best in trending markets. It may underperform in choppy or range-bound markets.
Strategy Example:
XRP/USD Example:
If you're trading XRP/USD and the Fast EMA (9) crosses above the Slow EMA (21), while the RSI is above 50, the indicator will signal a Buy.
Conversely, if the Fast EMA (9) crosses below the Slow EMA (21), and the RSI is below 50, the indicator will signal a Sell.
Bitcoin (BTC/USD):
On the BTC/USD chart, when the indicator shows a green arrow and a Buy label, it’s signaling a potential long entry. Similarly, a red arrow and Sell label indicate a short entry or exit from a previous long position.
Summary:
The EMA RSI Trend Reversal Indicator helps traders identify potential trend reversals with clear buy and sell signals based on the EMA crossovers and RSI confirmations. By using green arrows and red arrows, along with Buy and Sell labels, this strategy offers easy-to-understand visual signals for entering and exiting trades. Combine this with effective risk management and backtesting to optimize your trading performance.

Daniels Script v2 EMA 4h y DTitle:
"EMA 200 Dynamic Projection on 4H and Daily Charts"
Description:
"This script is designed to provide traders with a comprehensive view of market trends by displaying the 200-period Exponential Moving Average (EMA) on both 4-hour and daily charts simultaneously. Unlike typical EMA representations, this script enhances user decision-making by projecting the potential future path of these EMAs using a dynamic slope calculation.
The dynamic projection feature calculates the slope based on recent changes in the EMA, allowing traders to visualize potential future trends more accurately. This innovative approach helps in identifying potential areas of support and resistance before they are fully formed, offering traders a strategic advantage in planning their entries and exits.
Key Features:
Dual Time Frame Analysis: View 200-period EMAs for both 4-hour and daily charts on a single graph.
Dynamic EMA Projections: Projected using a calculated slope from recent EMA changes, presented as dotted lines for clear distinction.
Enhanced Trend Visualization: Helps in recognizing trend continuations or reversals early, aiding in risk management and decision-making processes.
Usage:
Simply add the script to your chart, and the EMAs along with their projections will automatically be displayed. The 4-hour EMA is shown in green, while the daily EMA is in red. Projections extend from the last known data point, providing a visual guide to potential future movements.
This script is unique in its approach to combining real-time EMA analysis with predictive modeling, making it a valuable tool for traders looking to enhance their technical analysis capabilities."
## SPANISH
Título del Script:
"Proyección Dinámica de la EMA 200 en Gráficos de 4H y Diarios"
Descripción del Script:
"Este script está diseñado para proporcionar a los traders una visión integral de las tendencias del mercado al mostrar la Media Móvil Exponencial (EMA) de 200 periodos tanto en los gráficos de 4 horas como diarios simultáneamente. A diferencia de las representaciones típicas de la EMA, este script mejora la toma de decisiones del usuario al proyectar el posible camino futuro de estas EMAs utilizando un cálculo de pendiente dinámico.
La función de proyección dinámica calcula la pendiente basada en cambios recientes en la EMA, permitiendo a los traders visualizar tendencias futuras potenciales con mayor precisión. Este enfoque innovador ayuda a identificar áreas potenciales de soporte y resistencia antes de que se formen completamente, ofreciendo a los traders una ventaja estratégica en la planificación de sus entradas y salidas.
Características Clave:
Análisis de Doble Marco Temporal: Visualiza las EMAs de 200 periodos para los gráficos de 4 horas y diarios en un solo gráfico.
Proyecciones Dinámicas de la EMA: Proyectadas utilizando una pendiente calculada a partir de cambios recientes en la EMA, presentadas como líneas punteadas para una clara distinción.
Visualización Mejorada de Tendencias: Ayuda en el reconocimiento temprano de continuaciones o reversos de tendencias, asistiendo en la gestión de riesgos y en los procesos de toma de decisiones.
Uso:
Simplemente añade el script a tu gráfico, y las EMAs junto con sus proyecciones se mostrarán automáticamente. La EMA de 4 horas se muestra en verde, mientras que la EMA diaria está en rojo. Las proyecciones se extienden desde el último punto de datos conocido, proporcionando una guía visual hacia movimientos futuros potenciales.
Este script es único en su enfoque de combinar análisis de EMA en tiempo real con modelado predictivo, convirtiéndolo en una herramienta valiosa para traders que buscan mejorar sus capacidades de análisis técnico."

Z-EMA Fusion BandsDesigned with crypto markets in mind, particularly Bitcoin , it builds on the concept that the 1-Week 50 EMA often serves as a long-term bull/bear market threshold — an area where institutional bias, momentum shifts, and cyclical rotations tend to occur.
🔹 Core Components & Synergies:
1. 1W 50 EMA (Higher Timeframe)
- This EMA is calculated on a weekly timeframe, regardless of your current chart.
- In crypto, price above the 1W 50 EMA typically aligns with long-term bull market phases, while extended periods below can signify bearish macro structure.
- The slope of the EMA is also analyzed to add directional confidence to trend strength.
2. ±1 Standard Deviation Bands
- Surrounding the 50 EMA, these bands visualize normal price dispersion relative to trend.
- When price consistently hugs or breaks outside these bands, it often reflects market expansion, volatility events, or mean-reversion opportunity.
3. Z-Score Gradient Fill
- The area between the bands is filled using a Z-score-based gradient, which dynamically adjusts color based on how far price is from the EMA (in terms of standard deviations).
- Color shifts from aqua (near EMA) to fuchsia (far from EMA) help you spot price compression, equilibrium, or overextension at a glance.
- The fill also uses transparency scaling, making it fade as price stretches further, emphasizing the core structure.
4. Directional EMA Coloring
- The EMA line itself is colored based on:
- The slope of the EMA (rising/falling)
- Whether the HTF candle is bullish or bearish
- This provides intuitive color-coded confirmation of momentum alignment or potential exhaustion.
5. Price/EMA Divergence Detection
- The script detects bullish and bearish divergence between price and the EMA (rather than using a traditional oscillator).
- Bullish Divergence: Price makes a lower low, EMA makes a higher low.
- Bearish Divergence: Price makes a higher high, EMA makes a lower high.
- These signals often mark transitional zones where momentum fades before a trend reversal or correction.
📊 Suggested Uses:
🔸 Swing and Position Trading:
- Use the 1W 50 EMA as a macro-trend anchor.
- Stay long-biased when price is above with positive slope, and short-biased when below.
- Consider entries near band edges for mean-reversion plays, especially if confluence forms with divergence signals.
🔸 Volatility-Based Filtering:
- Use the Z-score fill to identify volatility compression (near EMA) or expansion (edge of bands).
- Combine this with breakout strategies or dynamic position sizing.
🔸 Divergence Confirmation:
- Combine divergence markers with HTF EMA slope for high-probability setups.
- Bullish div + EMA flattening/rising can signal the start of accumulation after a macro dip.
🔸 Multi-Timeframe Analysis:
- Works well as a structural overlay on intraday charts (1H, 4H, 1D).
- Use this indicator to track long-term bias while executing lower timeframe trades.
⚠️ Disclaimer:
This indicator is designed for educational and informational purposes only. It does not constitute financial advice or a recommendation to buy or sell any asset.
Always use proper risk management, and combine with your own analysis, tools, and strategy. Performance in past market conditions does not guarantee future results.

EMA 12-26-100 Momentum Strategy# Triple EMA Multi-Signal Momentum Strategy
## 📊 Overview
**Triple EMA Multi-Signal** is a comprehensive trend-following momentum strategy designed specifically for cryptocurrency markets. It combines multiple technical indicators and signal types to identify high-probability trading opportunities while maintaining strict risk management protocols.
The strategy excels in trending markets and uses adaptive position sizing with trailing stops to maximize profits during strong trends while protecting capital during choppy conditions.
## 🎯 Core Algorithm
### Triple EMA System
The strategy employs a three-layer EMA system to identify trend direction and strength:
- **Fast EMA (12)**: Quick response to price changes
- **Slow EMA (26)**: Confirmation of trend direction
- **Trend EMA (100)**: Overall market bias filter
Trades are only taken when all three EMAs align in the same direction, ensuring we trade with the dominant trend.
### Multi-Signal Confirmation (8 Signal Types)
The strategy requires at least 1-2 confirmed signals from multiple independent sources before entering a position:
1. **EMA Crossover** - Fast EMA crossing Slow EMA (primary signal)
2. **MACD Cross** - MACD line crossing signal line (momentum confirmation)
3. **RSI Reversal** - RSI bouncing from oversold/overbought zones
4. **Price Action** - Strong bullish/bearish candles (>60% of range)
5. **Volume Spike** - Above-average volume confirmation
6. **Breakout** - Price breaking 20-period high/low with volume
7. **Pullback to EMA** - Trend continuation after healthy retracement
8. **Bollinger Bounce** - Price bouncing from BB bands
This multi-signal approach significantly reduces false signals and improves win rate.
## 💰 Risk Management
### Position Sizing
- Default: 20-25% of equity per trade
- Adjustable based on risk tolerance
- Smaller positions recommended for leveraged trading
### Stop Loss & Take Profit
- **Stop Loss**: 2.0% (tight control of risk)
- **Take Profit**: 5.5% (2.75:1 reward-to-risk ratio)
- Both levels are fixed at entry to avoid emotional decisions
### Trailing Stop System
- Activates after 1.8% profit
- Trails at 1.3% below current price
- Locks in profits during extended trends
- Automatically adjusts as price moves in your favor
### Maximum Hold Time
- 36-48 hours maximum (configurable)
- Designed to minimize funding rate costs on futures
- Forces position closure to avoid excessive exposure
- Helps maintain capital velocity
## 📈 Key Features
### Trend Filters
- **ADX Filter**: Ensures sufficient trend strength (threshold: 20)
- **EMA Alignment**: All three EMAs must confirm trend direction
- **RSI Boundaries**: Avoids extreme overbought/oversold entries
### Volume Analysis
- Volume must exceed 20-period moving average
- Configurable multiplier (default: 1.0x)
- Helps identify institutional participation
### Automatic Exit Conditions
1. Take Profit target reached
2. Stop Loss triggered
3. Trailing stop activated
4. Trend reversal (EMA cross in opposite direction)
5. Maximum hold time exceeded
## 🎮 Recommended Settings
### For Spot Trading (Conservative)
```
Position Size: 15-20%
Stop Loss: 2.5%
Take Profit: 6.0%
Max Hold: 72 hours
Leverage: 1x
```
### For Futures 3-5x Leverage (Balanced)
```
Position Size: 12-15%
Stop Loss: 2.0%
Take Profit: 5.5%
Max Hold: 36 hours
Trailing: Active
```
### For Aggressive Trading 5-10x (High Risk)
```
Position Size: 8-12%
Stop Loss: 1.5%
Take Profit: 4.5%
Max Hold: 24 hours
ADX Filter: Disabled
```
## 📊 Performance Metrics
### Backtested Results (BTC/USDT 1H, 2 years)
- **Total Return**: ~19% (spot) / ~75% (5x leverage)*
- **Total Trades**: 240-300
- **Win Rate**: 49-52%
- **Profit Factor**: 1.25-1.50
- **Max Drawdown**: ~18-22%
- **Average Trade**: 0.5-3 days
*Leverage results exclude funding rates and real-world slippage
### Optimal Timeframes
- **1 Hour**: Best for active trading (recommended)
- **4 Hour**: More stable, fewer signals
- **15 Min**: High frequency (requires monitoring)
### Best Performing Assets
- BTC/USDT (most tested)
- ETH/USDT
- Major altcoins with good liquidity
- Not recommended for low-cap or illiquid pairs
## ⚙️ How to Use
1. **Add to Chart**: Apply strategy to 1H BTC/USDT chart
2. **Adjust Settings**: Configure risk parameters based on your preference
3. **Review Signals**: Green = Long, Red = Short, labels show signal count
4. **Monitor Performance**: Check strategy tester for detailed statistics
5. **Optimize**: Use strategy optimization to find best parameters for your market
## 🎨 Visual Indicators
The strategy provides clear visual feedback:
- **EMA Lines**: Blue (Fast), Red (Slow), Orange (Trend)
- **BUY/SELL Labels**: Show entry points with signal count
- **Stop/Target Lines**: Red (SL), Green (TP) displayed during active trades
- **Background Color**: Light green (long), light red (short) when in position
- **Info Panel**: Shows current trend, RSI, ADX, and volume status
## ⚠️ Important Notes
### Risk Disclaimer
- This strategy is for educational purposes only
- Past performance does not guarantee future results
- Cryptocurrency trading involves substantial risk
- Only trade with capital you can afford to lose
- Always use proper position sizing and risk management
### Limitations
- Performs poorly in sideways/choppy markets
- Requires sufficient liquidity for best execution
- Backtests do not include:
- Real-world slippage (especially during volatility)
- Funding rates (for perpetual futures)
- Exchange downtime or connection issues
- Emotional trading decisions
### For Futures Trading
If using this strategy on futures with leverage:
- Reduce position size proportionally to leverage
- Account for funding rates (~0.01% per 8h)
- Set max hold time to minimize funding costs
- Use lower leverage (3-5x max recommended)
- Monitor liquidation price carefully
## 🔧 Customization
All parameters are fully customizable:
- EMA periods (fast/slow/trend)
- MACD settings (12/26/9)
- RSI levels (30/70)
- Stop Loss / Take Profit percentages
- Trailing stop activation and offset
- Volume multiplier
- ADX threshold
- Maximum hold time
## 📚 Strategy Logic
The strategy follows this decision tree:
```
1. Check Trend Direction (EMA alignment)
↓
2. Scan for Entry Signals (8 types)
↓
3. Confirm with Filters (ADX, Volume, RSI)
↓
4. Enter Position with Fixed SL/TP
↓
5. Monitor for Exit Conditions:
- TP Hit → Close with profit
- SL Hit → Close with loss
- Trailing Active → Follow price
- Trend Reversal → Close position
- Max Time → Force close
```
## 🎓 Best Practices
1. **Start Conservative**: Use smaller position sizes initially
2. **Track Performance**: Monitor actual vs backtested results
3. **Optimize Regularly**: Market conditions change, adapt parameters
4. **Combine with Analysis**: Don't rely solely on automated signals
5. **Manage Emotions**: Stick to the system, avoid manual overrides
6. **Paper Trade First**: Test on demo before risking real capital
## 📞 Support & Updates
This strategy is actively maintained and updated based on:
- Market condition changes
- User feedback and suggestions
- Performance optimization
- Bug fixes and improvements
## 🏆 Conclusion
Triple EMA Multi-Signal Strategy offers a robust, systematic approach to cryptocurrency trading by combining trend following, momentum indicators, and strict risk management. Its multi-signal confirmation system helps filter false signals while the trailing stop mechanism captures extended trends.
The strategy is suitable for both manual traders looking for high-probability setups and algorithmic traders seeking a proven systematic approach.
**Remember**: No strategy wins 100% of the time. Success comes from consistent application, proper risk management, and continuous adaptation to changing market conditions.
---
*Version: 1.0*
*Last Updated: November 2025*
*Tested on: BTC/USDT, ETH/USDT (1H, 4H timeframes)*
*Recommended Capital: $5,000+ for optimal position sizing*

Multi EMA + Golden Trio Crossover (Bullish & Bearish) by SKL📌 Multi EMA + Golden Trio Crossover (Bullish & Bearish) — by SKL
This indicator plots six key Exponential Moving Averages (EMA 5, 13, 26, 50, 100, 200) and highlights powerful momentum shift signals through the Golden Trio Crossover — a unique setup where EMA 5 crosses both EMA 13 and EMA 26 in the same candle .
It works for both bullish and bearish conditions, making it suitable for intraday, swing, and positional trading.
🔍 What is the Golden Trio Crossover?
A Golden Trio Crossover occurs when:
Bullish: EMA 5 crosses ** above ** EMA 13 *and* EMA 26 in the same candle
Bearish: EMA 5 crosses ** below ** EMA 13 *and* EMA 26 in the same candle
This triple-confirmation crossover often signals:
Early trend reversals
Strong continuation breakouts
Momentum shift points
📈 What This Indicator Includes
1. Six EMA Lines
EMA 5 – Blue
EMA 13 – Green
EMA 26 – Orange
EMA 50 – Black
EMA 100 – Gray
EMA 200 – Red
These EMAs help traders track trend direction, strength, and structure.
🌟 Visual Highlights
Green background → Bullish Golden Trio
Red background → Bearish Golden Trio
Label markers on each signal
“BULL GCO”
“BEAR GCO”
🔔 Alerts Included
You can enable alerts for:
Bullish Golden Trio Crossover
Bearish Golden Trio Crossover
Useful for breakout traders, scalpers, and swing traders.
🎯 How Traders Use This Indicator
Identify early trend shifts
Spot high-probability breakout candles
Confirm entries with multi-EMA confluence
Combine with volume, price action, or RSI for even stronger setups
📌 Notes
Works on all timeframes
Works on all asset classes (Stocks, Indices, Crypto, Forex, Commodities)
Fully automatic signal detection

Multi-Symbol EMA Crossover Scanner with Multi-Timeframe AnalysisDescription
What This Indicator Does:
This indicator is a comprehensive market scanner that monitors up to 10 symbols simultaneously across 4 different timeframes (15-minute, 1-hour, 4-hour, and daily) to detect exponential moving average (EMA) crossovers in real-time. Instead of manually checking multiple charts and timeframes for EMA crossover signals, this scanner automatically does the work for you and presents all detected signals in a clean, organized table that updates continuously throughout the trading session.
Key Features:
Multi-Symbol Monitoring: Scan up to 10 different symbols at once (stocks, forex, crypto, or any TradingView symbol)
Multi-Timeframe Analysis: Simultaneously tracks 4 timeframes (15m, 1H, 4H, 1D) with toggle options to enable/disable each
Comprehensive EMA Pairs: Detects crossovers between all major EMA combinations: 20×50, 20×100, 20×200, 50×100, 50×200, and 100×200
Real-Time Signal Feed: Displays the most recent signals in a sorted table (newest first) with timestamp, direction, price, and EMA pair information
Session Filter: Built-in time filter (default 10:00-18:00) to focus on specific trading hours and avoid pre-market/after-hours noise
Pagination System: Navigate through signals using a page selector when you have more signals than fit in one view
Signal Statistics: Footer displays total signals, bullish/bearish breakdown, and page navigation hints
Customizable Display: Choose table position (4 corners), signals per page (5-20), and maximum signal history (10-100)
How It Works:
The scanner uses the request.security() function to fetch EMA data from multiple symbols and timeframes simultaneously. For each symbol-timeframe combination, it calculates four exponential moving averages (20, 50, 100, and 200 periods) and monitors for crossovers:
Bullish Crossovers (▲ Green):
Faster EMA crosses above slower EMA
Indicates potential upward momentum
Common entry signals for long positions
Bearish Crossovers (▼ Red):
Faster EMA crosses below slower EMA
Indicates potential downward momentum
Common entry signals for short positions or exits
The scanner prioritizes crossovers involving faster EMAs (20×50) over slower ones (100×200), as faster crossovers typically generate more frequent signals. Each detected crossover is stored with its timestamp, allowing the scanner to sort signals chronologically and remove duplicates within the same timeframe.
Signal Table Columns:
Sym: Symbol name (abbreviated, e.g., "ASELS" instead of "BIST:ASELS")
TF: Timeframe where the crossover occurred (15m, 1h, 4h, 1D)
⏰: Exact time of the crossover (HH:MM format in Istanbul timezone)
↕: Direction indicator (▲ bullish green / ▼ bearish red)
₺: Price level where the crossover occurred (average of the two EMAs)
MA: Which EMA pair crossed (e.g., "20×50", "50×200")
How to Use:
For Day Traders:
Enable 15m and 1h timeframes
Monitor symbols from your watchlist
Use crossovers as entry timing signals in the direction of the larger trend
Adjust the time filter to match your trading session (e.g., market open to 2 hours before close)
For Swing Traders:
Enable 4h and 1D timeframes
Focus on 50×200 and 100×200 crossovers (golden/death crosses)
Look for multiple timeframe confluence (same symbol showing bullish crossovers on both 4h and 1D)
Use as a pre-market scanner to identify potential setups for the day
For Multi-Market Traders:
Mix symbols from different markets (stocks, forex, crypto)
Use the scanner to identify which markets are showing the most momentum
Track relative strength by comparing crossover frequency across symbols
Identify rotation opportunities when one asset shows bullish signals while another shows bearish
Setup Recommendations:
Default BIST (Turkish Stock Market) Setup:
The code comes pre-configured with 10 popular BIST stocks:
ASELS, EKGYO, THYAO, AKBNK, PGSUS, ASTOR, OTKAR, ALARK, ISCTR, BIMAS
For US Stocks:
Replace with symbols like: NASDAQ:AAPL, NASDAQ:TSLA, NASDAQ:NVDA, NYSE:JPM, etc.
For Forex:
Use pairs like: FX:EURUSD, FX:GBPUSD, FX:USDJPY, OANDA:XAUUSD, etc.
For Crypto:
Use exchanges like: BINANCE:BTCUSDT, COINBASE:ETHUSD, BINANCE:SOLUSDT, etc.
Settings Guide:
Symbol List (10 inputs):
Enter any valid TradingView symbol in "EXCHANGE:TICKER" format
Use symbols you actively trade or monitor
Mix different asset classes if desired
Timeframe Toggles:
15 Minutes: High-frequency signals, best for day trading
1 Hour: Balanced frequency, good for intraday swing trades
4 Hours: Lower frequency, quality swing trade signals
1 Day: Low frequency, major trend changes only
Time Filter:
Start Hour (10): Beginning of your trading session
End Hour (18): End of your trading session
Prevents signals during low-liquidity periods
Adjust to match your market's active hours
Display Settings:
Table Position: Choose corner placement (doesn't interfere with other indicators)
Max Signals (40): Total historical signals to keep in memory
Signals Per Page (10): How many rows to show at once
Page Number: Navigate through signal history (auto-adjusts to available pages)
What Makes This Original:
Multi-symbol scanners exist on TradingView, but this indicator's originality comes from:
Comprehensive EMA Pair Coverage: Most scanners focus on 1-2 EMA pairs, this monitors 6 different combinations simultaneously
Unified Multi-Timeframe View: Presents signals from 4 timeframes in a single, chronologically sorted feed rather than separate panels
Session-Aware Filtering: Built-in time filter prevents signal overload from 24-hour markets
Smart Pagination: Handles large signal volumes gracefully with page navigation instead of scrolling
Signal Deduplication: Prevents the same crossover from appearing multiple times if it persists across several bars
Price-at-Cross Recording: Captures the exact price where the crossover occurred, not just that it happened
Real-Time Statistics: Live tracking of bullish vs bearish signal distribution
Trading Strategy Examples:
Trend Confirmation Strategy:
Find a symbol showing bullish crossover on 1D (major trend change)
Wait for pullback
Enter when 1h shows bullish crossover (confirmation)
Exit when 1h shows bearish crossover
Multi-Timeframe Confluence:
Look for symbols appearing multiple times with same direction
Example: ASELS shows ▲ on both 4h and 1D = strong bullish signal
Avoid symbols showing conflicting signals (▲ on 1h but ▼ on 4h)
Rotation Scanner:
Monitor 10+ symbols from the same sector
Identify which are turning bullish (▲) first
Enter leaders, avoid laggards
Rotate out when crossovers turn bearish (▼)
Important Considerations:
Not a Complete System: EMA crossovers should be confirmed with price action, volume, and support/resistance analysis
Whipsaw Risk: During consolidation, EMAs can cross back and forth frequently (especially on 15m timeframe)
Lag: EMAs are lagging indicators; crossovers occur after the move has already begun
False Signals: More common during sideways markets; work best in trending environments
Symbol Limits: TradingView has limits on request.security() calls; this scanner uses 40 calls (10 symbols × 4 timeframes)
Performance: On lower-end devices, scanning 10 symbols across 4 timeframes may cause slight delays in chart updates
Best Practices:
Start with 5 symbols and 2 timeframes, then expand as you get comfortable
Use in conjunction with a main chart for price context
Don't trade every signal—filter for high-quality setups
Backtest your favorite EMA pairs on your symbols to understand their reliability
Adjust the time filter to exclude lunch hours if your market has low midday volume
Check the footer statistics—if you're getting 50+ signals per day, tighten your time filter or reduce symbols
Technical Notes:
Uses lookahead=barmerge.lookahead_off to prevent future data leakage
Signals are stored in arrays and sorted by timestamp (newest first)
Automatic daily reset clears old signals to prevent memory buildup
Table dynamically resizes based on signal count
All times displayed in Europe/Istanbul timezone (configurable in code)

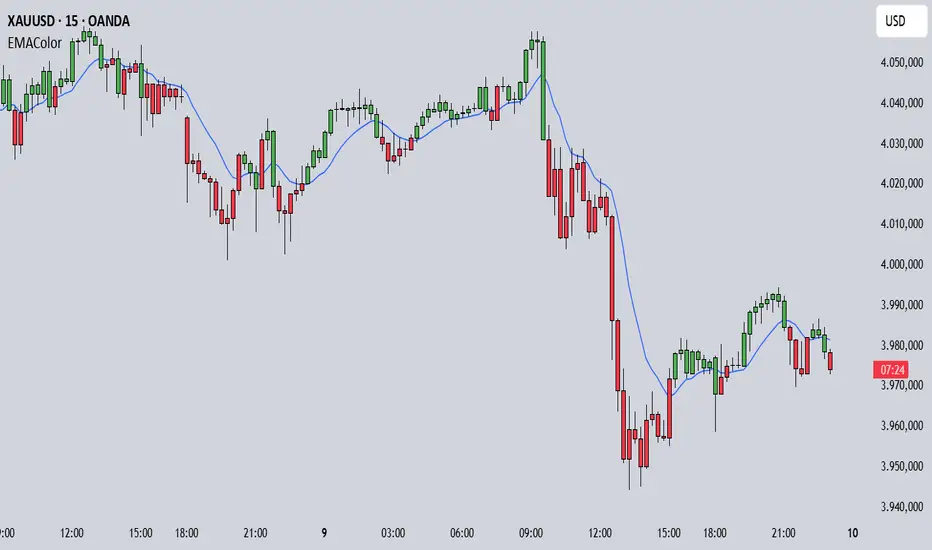
EMA Candle ColorEMA Candle Color - Visual EMA-Based Candle Coloring System
Overview:
This indicator provides a visual approach to trend identification by coloring candles based on their relationship with an Exponential Moving Average (EMA). The script dynamically colors both the candle bars and plots custom candles to give traders an immediate visual representation of price momentum relative to the EMA.
How It Works:
The indicator calculates an EMA based on your chosen source (default: open price) and length (default: 10 periods). It then applies a simple yet effective rule:
When the source price is ABOVE the EMA → Candles turn GREEN (bullish)
When the source price is BELOW the EMA → Candles turn RED (bearish)
This instant visual feedback helps traders quickly identify:
Current trend direction
Potential support/resistance levels (the EMA line itself)
Momentum shifts when candles change color
Key Features:
Customizable EMA Parameters: Adjust the EMA length (1-500) and source (open, close, high, low, hl2, hlc3, ohlc4)
Custom Color Selection: Choose your preferred bullish and bearish colors to match your chart theme
Dual Visualization: Both bar coloring and custom plotcandle for enhanced visibility
Offset Capability: Shift the EMA line forward or backward for advanced analysis
Clean Design: Minimal overlay that doesn't clutter your chart
How to Use:
1. Add the indicator to your chart
2. Adjust the EMA Length based on your trading timeframe:
- Shorter periods (5-20) for day trading and scalping
- Medium periods (20-50) for swing trading
- Longer periods (50-200) for position trading
3. Watch for candle color changes as potential entry/exit signals
4. Combine with other indicators for confirmation
Trading Applications:
Trend Following: Stay in trades while candles remain the same color
Reversal Signals: Watch for color changes as early reversal warnings
Filter System: Only take long positions during green candles, shorts during red
Visual Clarity: Quickly assess market sentiment at a glance
Settings:
Length: EMA calculation period (default: 10)
Source: Price data used for EMA calculation (default: open)
Offset: Shift EMA line on chart (default: 0)
Bullish Color: Color for candles above EMA (default: green)
Bearish Color: Color for candles below EMA (default: red)
Technical Details:
The script uses Pine Script v6 and employs the standard ta.ema() function for smooth, responsive EMA calculations. The candle coloring is achieved through both barcolor() and plotcandle() functions, ensuring visibility across different chart settings.
Note:
This indicator works on all timeframes and instruments. For best results, combine with proper risk management and additional confirmation indicators. The EMA Candle Color system is designed to simplify trend identification, not as a standalone trading system.
Tips:
Use on higher timeframes for more reliable signals
Combine with volume analysis for confirmation
Consider using multiple EMA periods for confluence
Disable default candles if using the plotcandle feature to avoid overlap
This script is open-source. Feel free to use it as a foundation for your own trading system or modify it to suit your specific trading style.
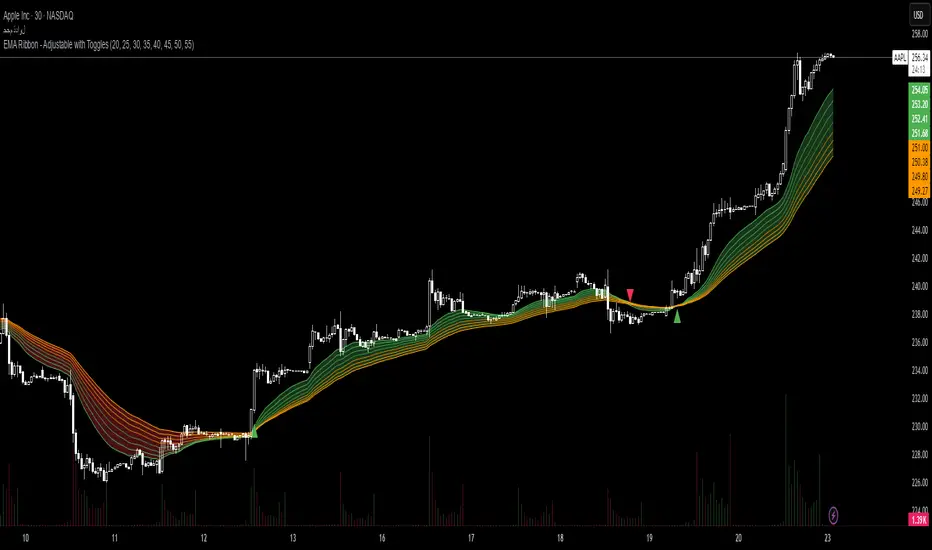
EMA Ribbon - Adjustable with Toggles📌 Script Name:
EMA Ribbon - Adjustable with Toggles
🧠 Primary Function:
This script plots a customizable Exponential Moving Average (EMA) Ribbon on Trading View charts. It allows the user to enable or disable any of the 8 EMAs individually and shows buy/sell signals based on the crossover between the fastest and slowest EMAs.
⚙️ Key Features:
✅ User Controls:
Toggle ON/OFF each of the 8 EMAs independently.
Set the length of each EMA (from 1 upward).
EMA colors vary based on their speed (green for faster, orange for slower).
📈 EMA Calculation:
Calculates 8 separate EMAs using the closing price (close).
🎨 Chart Visualization:
Plots each EMA with a unique color and transparency.
Draws a colored ribbon between the highest and lowest active EMAs to visualize trend zones.
📊 Trend Direction Logic:
The trend is determined solely based on EMA 1 (fastest) and EMA 8 (slowest).
A bullish trend is when EMA 1 > EMA 8, and bearish when EMA 1 < EMA 8.
📍 Buy/Sell Signals:
Buy Signal: When the trend shifts from bearish to bullish (EMA 1 crosses above EMA 8).
Sell Signal: When the trend shifts from bullish to bearish (EMA 1 crosses below EMA 8).
Signals are displayed as green (buy) and red (sell) triangles on the chart.
🔔 Alerts:
Built-in alert conditions for buy and sell signals.
Custom alert messages in Arabic (can be modified if needed).
🌟 Additional Highlights:
Well-structured and easy to expand.
Great for trend-following strategies using EMA ribbons.
Helps identify consolidation zones and trend confirmation.
200 EMA w/ Ticker Memory200 EMA w/ Ticker Memory — Multi-Symbol & Multi-Timeframe EMA Tracker with Alerts
Overview
The 200 EMA w/ Ticker Memory indicator allows you to monitor the 200-period Exponential Moving Average (EMA) across multiple symbols and timeframes. Designed for traders managing multiple tickers, it provides customizable timeframe inputs per symbol and instant alerts on price touches of the 200 EMA.
Key Features
Multi-symbol support: Configure up to 20 different symbols, each with its own timeframe setting.
Flexible timeframe input: Assign specific timeframes per symbol or use a default timeframe fallback.
Accurate 200 EMA calculation: Uses request.security to fetch 200 EMA from the symbol-specific timeframe.
Visual EMA plots: Displays both the EMA on the selected timeframe and the EMA on the current chart timeframe for comparison.
Touch alerts: Configurable alerts when price “touches” the 200 EMA within a user-defined sensitivity percentage.
Ticker memory: Remembers your configured symbols and displays them in an on-chart table.
Compact info table: Displays current symbol status, alert settings, and timeframe in a clean, transparent table overlay.
How to Use
Configure Symbols and Timeframes:
Input your desired symbols (up to 20) and their respective timeframes under the “Symbol Settings” groups in the indicator’s settings pane.
Set Default Timeframe:
Choose a default timeframe to be used when no specific timeframe is assigned for a symbol.
Adjust Alert Settings:
Enable or disable alerts and set the touch sensitivity (% distance from EMA to trigger alerts).
Alerts
Alerts trigger once per bar when the price touches the 200 EMA within the defined sensitivity threshold.
Alert messages include:
Symbol / Current price / EMA value / EMA timeframe used / Chart timeframe / Timestamp
Customization
200 EMA Color: Change the line color for better visibility.
Touch Sensitivity: Fine-tune how close price must be to the EMA to count as a touch (default 0.1%).
Enable Touch Alerts: Turn on/off alert notifications easily.
For:
- Swing traders monitoring multiple stocks or assets.
- Day traders watching key EMA levels on different timeframes.
- Analysts requiring a quick visual and alert system for 200 EMA touches.
- Portfolio managers tracking key technical levels across various securities.
Limitations
Supports up to 20 configured symbols (can be extended manually if needed).
Works best on charts with reasonable bar frequency due to request.security usage.
Alert frequency is limited to once per bar for clarity.
Disclaimer
This indicator is provided “as-is” for educational and informational purposes only. It does not guarantee trading success or financial gain.

Consecutive Candles Above/Below EMADescription:
This indicator identifies and highlights periods where the price remains consistently above or below an Exponential Moving Average (EMA) for a user-defined number of consecutive candles. It visually marks these sustained trends with background colors and labels, helping traders spot strong bullish or bearish market conditions. Ideal for trend-following strategies or identifying potential trend exhaustion points, this tool provides clear visual cues for price behavior relative to the EMA.
How It Works:
EMA Calculation: The indicator calculates an EMA based on the user-specified period (default: 100). The EMA is plotted as a blue line on the chart for reference.
Consecutive Candle Tracking: It counts how many consecutive candles close above or below the EMA:
If a candle closes below the EMA, the "below" counter increments; any candle closing above resets it to zero.
If a candle closes above the EMA, the "above" counter increments; any candle closing below resets it to zero.
Highlighting Trends: When the number of consecutive candles above or below the EMA meets or exceeds the user-defined threshold (default: 200 candles):
A translucent red background highlights periods where the price has been below the EMA.
A translucent green background highlights periods where the price has been above the EMA.
Labeling: When the required number of consecutive candles is first reached:
A red downward arrow label with the text "↓ Below" appears for below-EMA streaks.
A green upward arrow label with the text "↑ Above" appears for above-EMA streaks.
Usage:
Trend Confirmation: Use the highlights and labels to confirm strong trends. For example, 200 candles above the EMA may indicate a robust uptrend.
Reversal Signals: Prolonged streaks (e.g., 200+ candles) might suggest overextension, potentially signaling reversals.
Customization: Adjust the EMA period to make it faster or slower, and modify the candle count to make the indicator more or less sensitive to trends.
Settings:
EMA Length: Set the period for the EMA calculation (default: 100).
Candles Count: Define the minimum number of consecutive candles required to trigger highlights and labels (default: 200).
Visuals:
Blue EMA line for tracking the moving average.
Red background for sustained below-EMA periods.
Green background for sustained above-EMA periods.
Labeled arrows to mark when the streak threshold is met.
This indicator is a powerful tool for traders looking to visualize and capitalize on persistent price trends relative to the EMA, with clear, customizable signals for market analysis.
Explain EMA calculation
Other trend indicators
Make description shorter
Adv EMA Cloud v6 (ADX, Alerts)Summary:
This indicator provides a multi-faceted view of market trends using Exponential Moving Averages (EMAs) arranged in visually intuitive clouds, enhanced with an optional ADX-based range filter and configurable alerts for key market conditions. It aims to help traders quickly gauge trend alignment across short, medium, and long timeframes while filtering signals during potentially choppy market conditions.
Key Features:
Multiple EMAs: Displays 10-period (Fast), 20-period (Mid), and 50-period (Slow) EMAs.
Long-Term Trend Filter: Includes a 200-period EMA to provide context for the overall dominant trend direction.
Dual EMA Clouds:
Fast/Mid Cloud (10/20 EMA): Fills the area between the 10 and 20 EMAs. Defaults to Green when 10 > 20 (bullish short-term momentum) and Red when 10 < 20 (bearish short-term momentum).
Mid/Slow Cloud (20/50 EMA): Fills the area between the 20 and 50 EMAs. Defaults to Aqua when 20 > 50 (bullish mid-term trend) and Fuchsia when 20 < 50 (bearish mid-term trend).
Optional ADX Range Filter: Uses the Average Directional Index (ADX) to identify potentially non-trending or choppy markets. When enabled and ADX falls below a user-defined threshold, the EMA clouds will turn grey, visually warning that trend-following signals may be less reliable.
Configurable Alerts: Provides several built-in alert conditions using Pine Script's alertcondition function:
Confluence Condition: Triggers when a 10/20 EMA crossover occurs while both EMA clouds show alignment (both bullish/green/aqua or both bearish/red/fuchsia) and price respects the 200 EMA filter and the ADX filter indicates a trend (if filters are enabled).
MA Filter Cross: Triggers when price crosses above or below the 200 EMA filter line.
Full Alignment Start: Triggers on the first bar where full bullish or bearish alignment occurs (both clouds aligned + MA filter respected + ADX trending, if filters are enabled).
How It Works:
EMA Calculation: Standard Exponential Moving Averages are calculated for the 10, 20, 50, and 200 periods based on the closing price.
Cloud Creation: The fill() function visually shades the area between the 10 & 20 EMAs and the 20 & 50 EMAs.
Cloud Coloring: The color of each cloud is determined by the relationship between the two EMAs that define it (e.g., if EMA 10 is above EMA 20, the first cloud is bullish-colored).
ADX Filter Logic: The script calculates the ADX value. If the "Use ADX Trend Filter?" input is checked and the calculated ADX is below the specified "ADX Trend Threshold", the script considers the market potentially ranging.
ADX Visual Effect: During detected ranging periods (if the ADX filter is active), the plotCloud12Color and plotCloud23Color variables are assigned a neutral grey color instead of their normal bullish/bearish colors before being passed to the fill() function.
Alert Logic: Boolean variables track the specific conditions (crossovers, cloud alignment, filter positions, ADX state). The alertcondition() function creates triggerable alerts based on these pre-defined conditions.
Potential Interpretation (Not Financial Advice):
Trend Alignment: When both clouds share the same directional color (e.g., both bullish - Green & Aqua) and price is on the corresponding side of the 200 EMA filter, it may suggest a stronger, more aligned trend. Conversely, conflicting cloud colors may indicate indecision or transition.
Dynamic Support/Resistance: The EMA lines themselves (especially the 20, 50, and 200) can sometimes act as dynamic levels where price might react.
Range Warning: Greyed-out clouds (when ADX filter is enabled) serve as a visual warning that trend-based strategies might face increased difficulty or whipsaws.
Confluence Alerts: The specific confluence alerts signal moments where multiple conditions align (crossover + cloud agreement + filters), which some traders might view as higher-probability setups.
Customization:
All EMA lengths (10, 20, 50, 200) are adjustable via the Inputs menu.
The ADX length and threshold are configurable.
The MA Trend Filter and ADX Trend Filter can be independently enabled or disabled.
Disclaimer:
This indicator is provided for informational and educational purposes only. Trading financial markets involves significant risk. Past performance is not indicative of future results. Always conduct your own thorough analysis and consider your risk tolerance before making any trading decisions. This indicator should be used in conjunction with other analysis methods and tools. Do not trade based solely on the signals or visuals provided by this indicator.

Supertrend and Fast and Slow EMA StrategyThis strategy combines Exponential Moving Averages (EMAs) and Average True Range (ATR) to create a simple, yet effective, trend-following approach. The strategy filters out fake or sideways signals by incorporating the ATR as a volatility filter, ensuring that trades are only taken during trending conditions. The key idea is to buy when the short-term trend (Fast EMA) aligns with the long-term trend (Slow EMA), and to avoid trades during low volatility periods.
How It Works:
EMA Crossover:
1). Buy Signal: When the Fast EMA (shorter-term, e.g., 20-period) crosses above the Slow EMA (longer-term, e.g., 50-period), this indicates a potential uptrend.
2). Sell Signal: When the Fast EMA crosses below the Slow EMA, this indicates a potential downtrend.
ATR Filter:
1). The ATR (Average True Range) is used to measure market volatility.
2). Trending Market: If the ATR is above a certain threshold, it indicates high volatility and a trending market. Only when ATR is above the threshold will the strategy generate buy/sell signals.
3). Sideways Market: If ATR is low (sideways or choppy market), the strategy will suppress signals to avoid entering during non-trending conditions.
When to Buy:
1). Condition 1: The Fast EMA crosses above the Slow EMA.
2). Condition 2: The ATR is above the defined threshold, indicating that the market is trending (not sideways or choppy).
When to Sell:
1). Condition 1: The Fast EMA crosses below the Slow EMA.
2). Condition 2: The ATR is above the defined threshold, confirming that the market is in a downtrend.
When Not to Enter the Trade:
1). Sideways Market: If the ATR is below the threshold, signaling low volatility and sideways or choppy market conditions, the strategy will not trigger any buy or sell signals.
2). False Crossovers: In low volatility conditions, price action tends to be noisy, which could lead to false signals. Therefore, avoiding trades during these periods reduces the risk of false breakouts.
Additional Factors to Consider Adding:
=> RSI (Relative Strength Index): Adding an RSI filter can help confirm overbought or oversold conditions to avoid buying into overextended moves or selling too low.
1). RSI Buy Filter: Only take buy signals when RSI is below 70 (avoiding overbought conditions).
2). RSI Sell Filter: Only take sell signals when RSI is above 30 (avoiding oversold conditions).
=> MACD (Moving Average Convergence Divergence): Using MACD can help validate the strength of the trend.
1). Buy when the MACD histogram is above the zero line and the Fast EMA crosses above the Slow EMA.
2). Sell when the MACD histogram is below the zero line and the Fast EMA crosses below the Slow EMA.
=> Support/Resistance Levels: Adding support and resistance levels can help you understand market structure and decide whether to enter or exit a trade.
1). Buy when price breaks above a significant resistance level (after a valid buy signal).
2). Sell when price breaks below a major support level (after a valid sell signal).
=> Volume: Consider adding a volume filter to ensure that buy/sell signals are supported by strong market participation. You could only take signals if the volume is above the moving average of volume over a certain period.
=> Trailing Stop Loss: Instead of a fixed stop loss, use a trailing stop based on a percentage or ATR to lock in profits as the trade moves in your favor.
=> Exit Signals: Besides the EMA crossover, consider adding Take Profit or Stop Loss levels, or even using a secondary indicator like RSI to signal an overbought/oversold condition and exit the trade.
Example Usage:
=> Buy Example:
1). Fast EMA (20-period) crosses above the Slow EMA (50-period).
2). The ATR is above the threshold, confirming that the market is trending.
3). Optionally, if RSI is below 70, the buy signal is further confirmed as not being overbought.
=> Sell Example:
1). Fast EMA (20-period) crosses below the Slow EMA (50-period).
2). The ATR is above the threshold, confirming that the market is trending.
3). Optionally, if RSI is above 30, the sell signal is further confirmed as not being oversold.
Conclusion:
This strategy helps to identify trending markets and filters out sideways or choppy market conditions. By using Fast and Slow EMAs combined with the ATR volatility filter, it provides a reliable approach to catching trending moves while avoiding false signals during low-volatility, sideways markets.

EMA Study Script for Price Action Traders, v2JR_EMA Research Tool Documentation
Version 2 Enhancements
Version 2 of the JR_EMA Research Tool introduces several powerful features that make it particularly valuable for studying price action around Exponential Moving Averages (EMAs). The key improvements focus on tracking and analyzing price-EMA interactions:
1. Cross Detection and Counting
- Implements flags for crossing bars that instantly identify when price crosses above or below the EMA
- Maintains running counts of closes above and below the EMA
- This feature helps students understand the persistence of trends and the frequency of EMA interactions
2. Bar Number Tracking
- Records the specific bar number when EMA crosses occur
- Stores the previous crossing bar number for reference
- Enables precise measurement of time between crosses, helping identify typical trend durations
3. Variable Reset Management
- Implements sophisticated reset logic for all counting variables
- Ensures accuracy when analyzing multiple trading sessions
- Critical for maintaining clean data when studying patterns across different timeframes
4. Cross Direction Tracking
- Monitors the direction of the last EMA cross
- Helps students identify the current trend context
- Essential for understanding trend continuation vs reversal scenarios
Educational Applications
Price-EMA Relationship Studies
The tool provides multiple ways to study how price interacts with EMAs:
1. Visual Analysis
- Customizable EMA bands show typical price deviation ranges
- Color-coded fills help identify "normal" vs "extreme" price movements
- Three different band calculation methods offer varying perspectives on price volatility
2. Quantitative Analysis
- Real-time tracking of closes above/below EMA
- Running totals help identify persistent trends
- Cross counting helps understand typical trend duration
Research Configurations
EMA Configuration
- Adjustable EMA period for studying different trend timeframes
- Customizable EMA color for visual clarity
- Ideal for comparing different EMA periods' effectiveness
Bands Configuration
Three distinct calculation methods:
1. Full Average Bar Range (ABR)
- Uses the entire range of price movement
- Best for studying overall volatility
2. Body Average Bar Range
- Focuses on the body of the candle
- Excellent for studying conviction in price moves
3. Standard Deviation
- Traditional statistical approach
- Useful for comparing to other technical studies
Signal Configuration
- Optional signal plotting for entry/exit studies
- Helps identify potential trading opportunities
- Useful for backtesting strategy ideas
Using the Tool for Study
Basic Analysis Steps
1. Start with the default 20-period EMA
2. Observe how price interacts with the EMA line
3. Monitor the data window for quantitative insights
4. Use band settings to understand normal price behavior
Advanced Analysis
1. Pattern Recognition
- Use the cross counting system to identify typical pattern lengths
- Study the relationship between cross frequency and trend strength
- Compare different timeframes for fractal analysis
2. Volatility Studies
- Compare different band calculation methods
- Identify market regimes through band width changes
- Study the relationship between volatility and trend persistence
3. Trend Analysis
- Use the closing price count system to measure trend strength
- Study the relationship between trend duration and subsequent reversals
- Compare different EMA periods for optimal trend following
Best Practices for Research
1. Systematic Approach
- Start with longer timeframes and work down
- Document observations about price behavior in different market conditions
- Compare results across multiple symbols and timeframes
2. Data Collection
- Use the data window to record significant events
- Track the number of bars between crosses
- Note market conditions when signals appear
3. Optimization Studies
- Test different EMA periods for your market
- Compare band calculation methods for your trading style
- Document which settings work best in different market conditions
Technical Implementation Notes
This tool is particularly valuable for educational purposes because it combines visual and quantitative analysis in a single interface, allowing students to develop both intuitive and analytical understanding of price-EMA relationships.
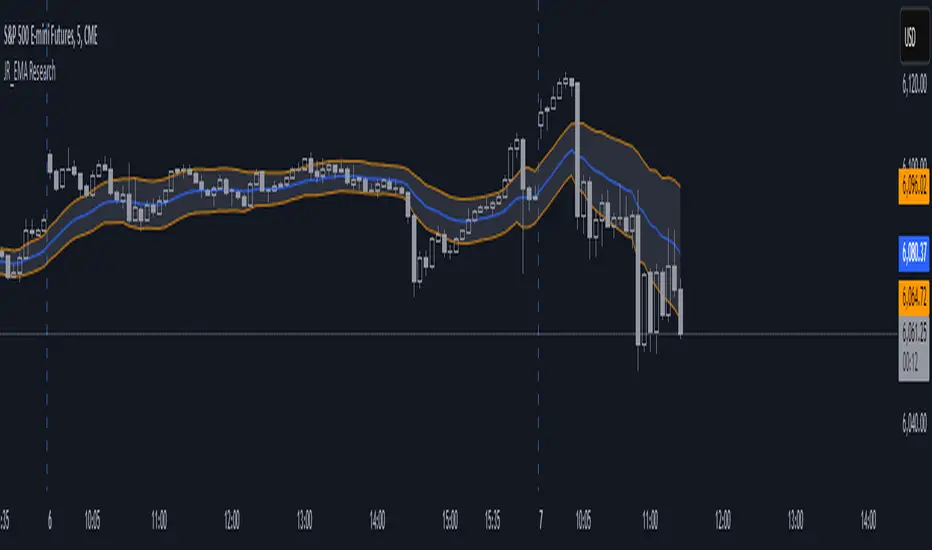
Tandem EMA TrendsThis indicator helps to identify trends using 2 (tandem) EMAs: a fast EMA and a slow EMA. Set the lengths of the EMAs in the inputs (fast EMA should be a smaller number than the slow EMA).
The trend is bullish if the current value of the fast EMA > current value of the slow EMA AND the current value of the fast EMA > the prior bar's value of the fast EMA.
The trend is bearish if the current value of the fast EMA < current value of the slow EMA AND the current value of the fast EMA < the prior bar's value of the fast EMA.
The fast EMA is countertrend to the slow EMA if either of the following 2 conditions exist:
The current value of the fast EMA > current value of the slow EMA AND the current value of the fast EMA < the prior bar's value of the fast EMA (bullish countertrend).
-OR-
The current value of the fast EMA < current value of the slow EMA AND the current value of the fast EMA > the prior bar's value of the fast EMA (bearish countertrend).
Use this script to set custom alerts based off of the current trend like sending webhooks when specific conditions exist.
Customize the colors of the plots.
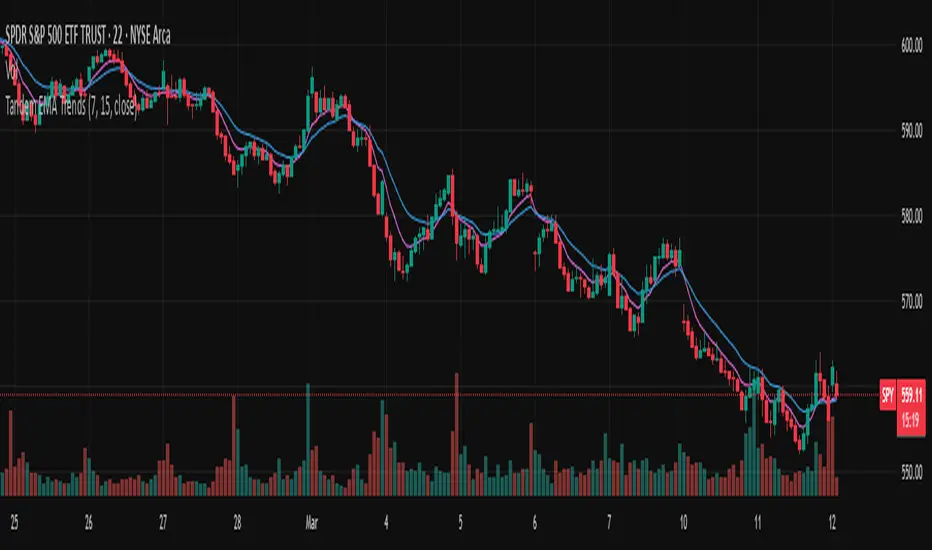
IU EMA Channel StrategyIU EMA Channel Strategy
Overview:
The IU EMA Channel Strategy is a simple yet effective trend-following strategy that uses two Exponential Moving Averages (EMAs) based on the high and low prices. It provides clear entry and exit signals by identifying price crossovers relative to the EMAs while incorporating a built-in Risk-to-Reward Ratio (RTR) for effective risk management.
Inputs ( Settings ):
- RTR (Risk-to-Reward Ratio): Define the ratio for risk-to-reward (default = 2).
- EMA Length: Adjust the length of the EMA channels (default = 100).
How the Strategy Works
1. EMA Channels:
- High-based EMA: EMA calculated on the high price.
- Low-based EMA: EMA calculated on the low price.
The area between these two EMAs creates a "channel" that visually highlights potential support and resistance zones.
2. Entry Rules:
- Long Entry: When the price closes above the high-based EMA (crossover).
- Short Entry: When the price closes below the low-based EMA (crossunder).
These entries ensure trades are taken in the direction of momentum.
3. Stop Loss (SL) and Take Profit (TP):
- Stop Loss:
- For long positions, the SL is set at the previous bar's low.
- For short positions, the SL is set at the previous bar's high.
- Take Profit:
- TP is automatically calculated using the Risk-to-Reward Ratio (RTR) you define.
- Example: If RTR = 2, the TP will be 2x the risk distance.
4. Exit Rules:
- Positions are closed at either the stop loss or the take profit level.
- The strategy manages exits automatically to enforce disciplined risk management.
Visual Features
1. EMA Channels:
- The high and low EMAs are dynamically color-coded:
- Green: Price is above the EMA (bullish condition).
- Red: Price is below the EMA (bearish condition).
- The area between the EMAs is shaded for better visual clarity.
2. Stop Loss and Take Profit Zones:
- SL and TP levels are plotted for both long and short positions.
- Zones are filled with:
- Red: Stop Loss area.
- Green: Take Profit area.
Be sure to manage your risk and position size properly.
